Fast pages keep visitors

Core Web Vitals measured on real visitors, on every page load. No lab runs needed.
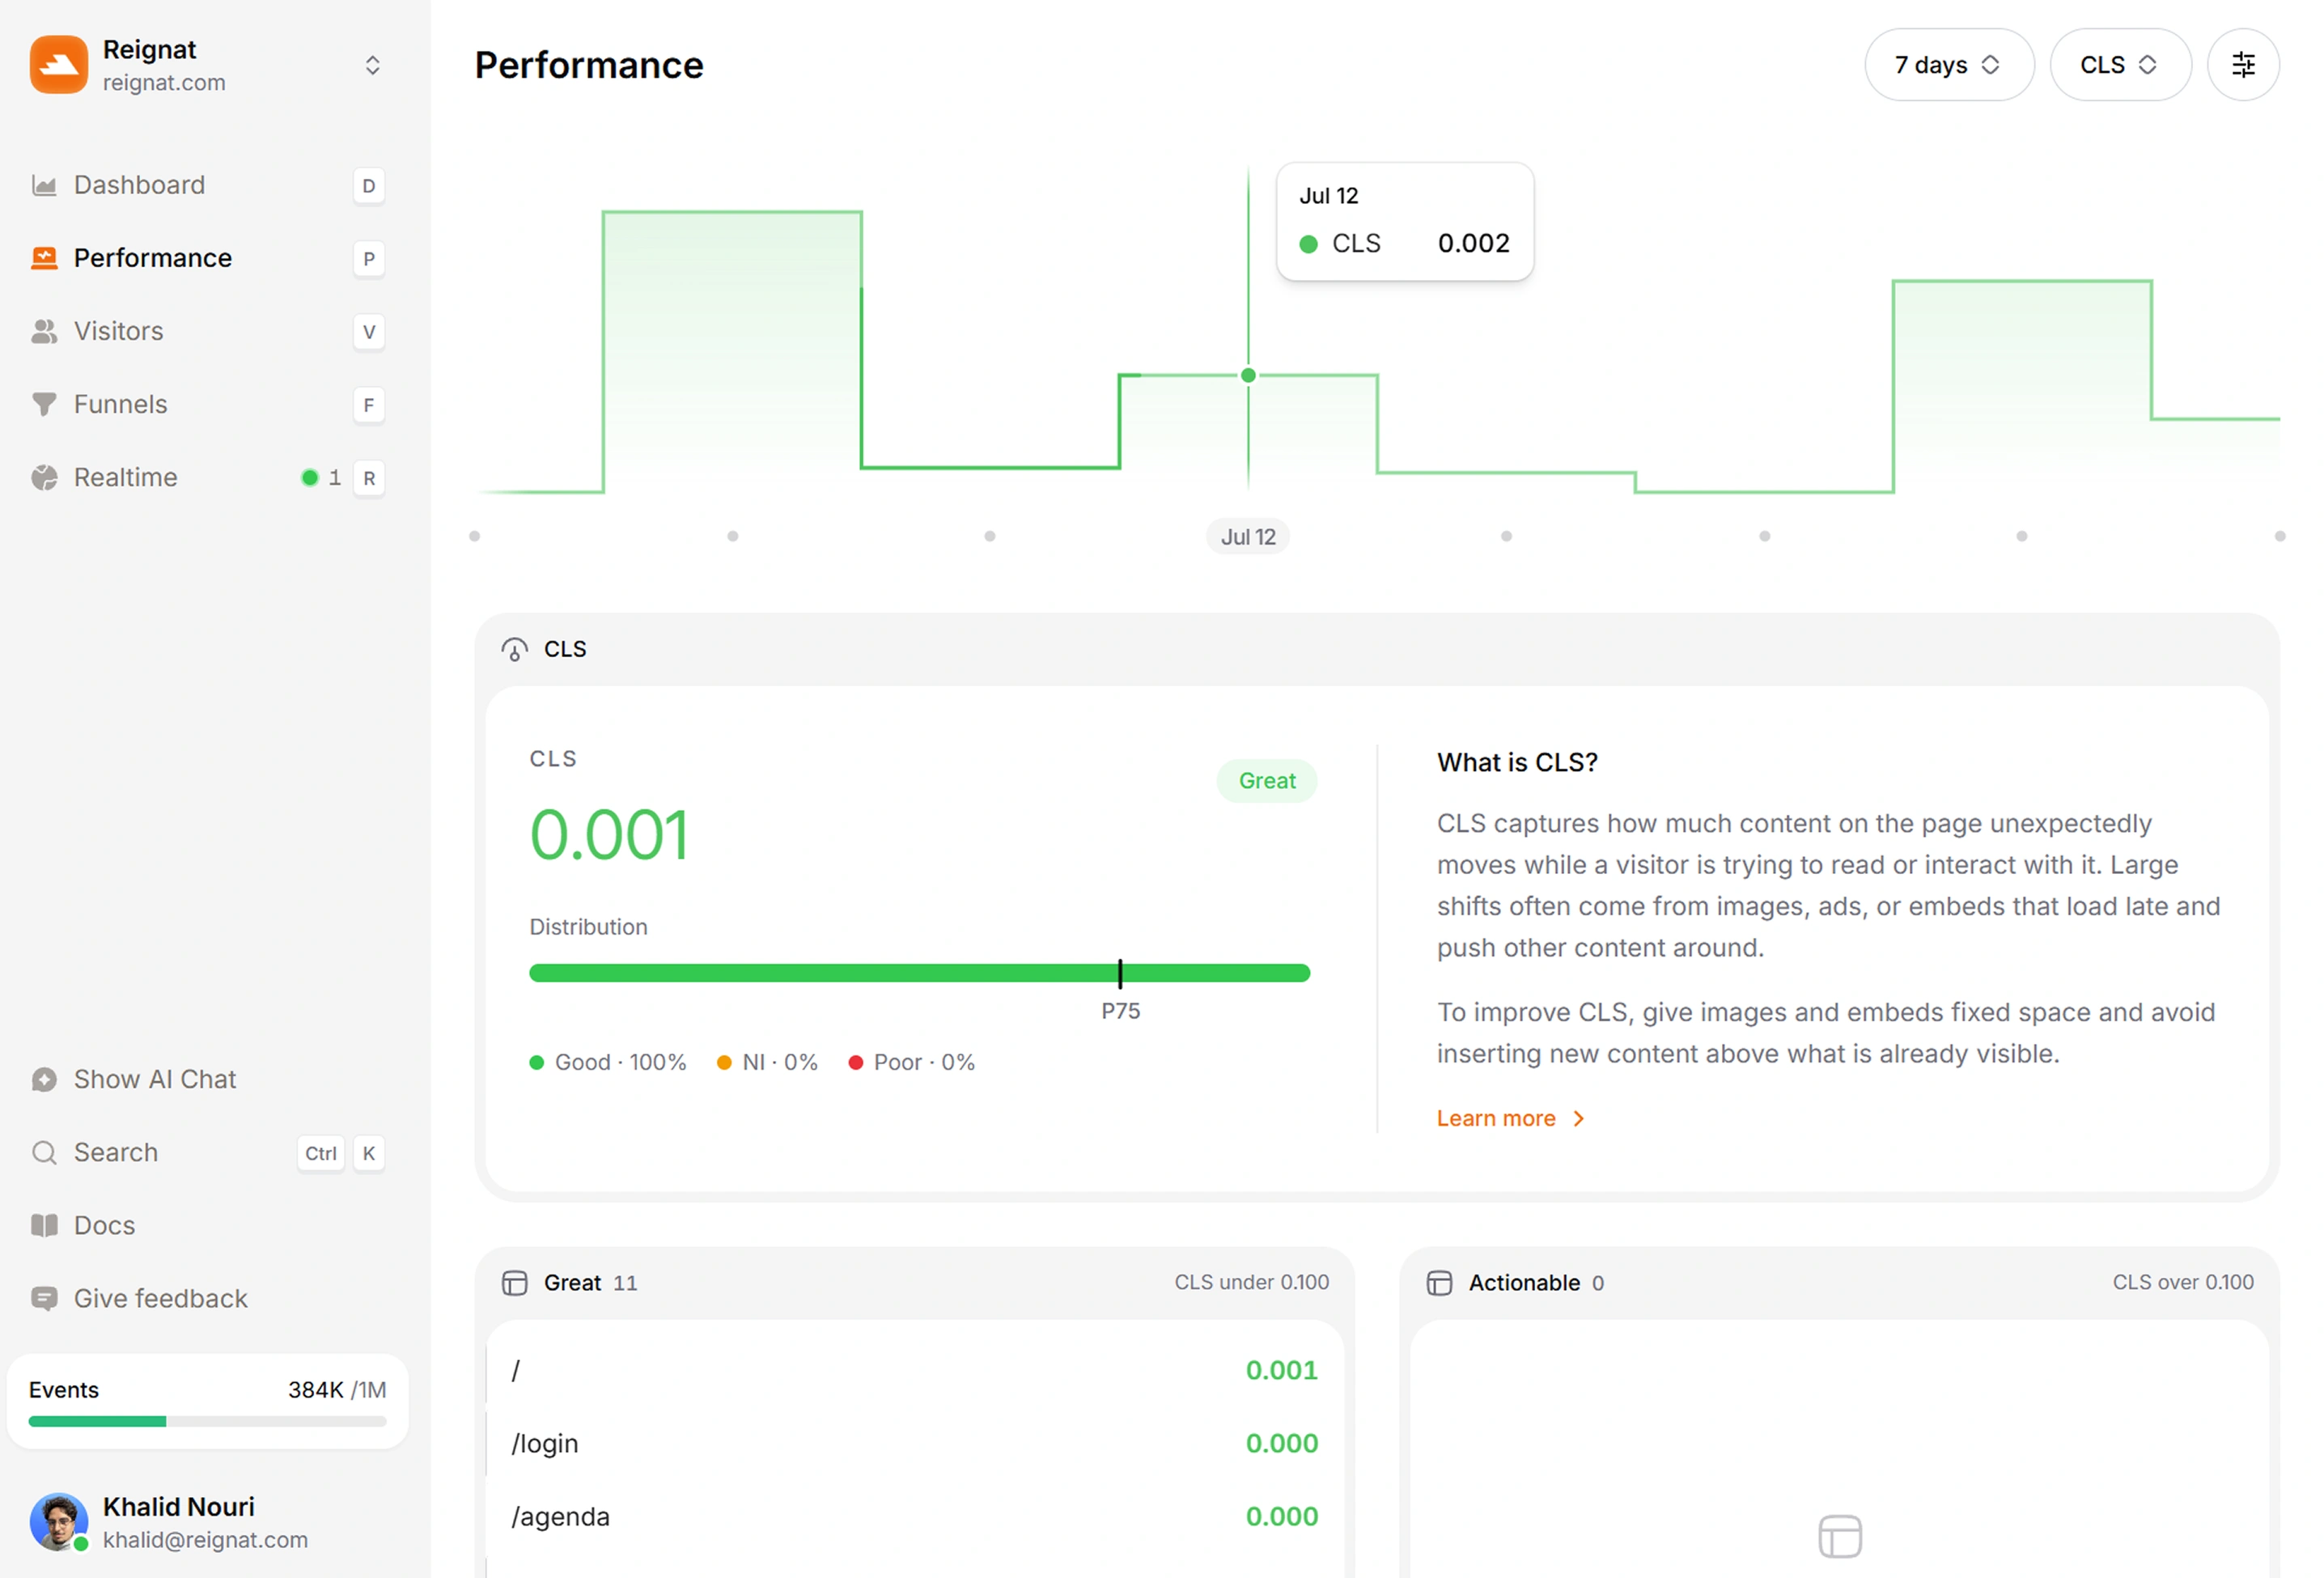
Speed is a feature you can watch
Slow pages cost signups and rankings. Reignat shows you where your site drags, from real traffic.
Real-user Web Vitals
LCP, CLS, INP and friends measured from actual visits, not synthetic lab tests.
An experience score
One score sums up how your site feels, with the vitals behind it one click away.
Slowest pages first
A per-page breakdown surfaces the exact URLs that drag, so you fix what matters first.
By device and country
See where performance differs across devices and regions before your users complain.
A 2kb script
The tracker itself is tiny and async, so measuring performance never hurts performance.
Ask about speed
Ask which pages got slower after the last deploy and get an instant answer with charts.
Understand your traffic clearly
Your live traffic, visitor journeys, global reach, and site performance in one dashboard built to help you grow.
Revenue Attribution
Connect every sale back to the page, source, and campaign that earned it, so you know exactly where to invest.
Explore revenue attributionVisitor Profile
Follow each visitor from first click to conversion, with full journeys, sessions, and the moments that mattered.
See a live profileNo cookie banners
Reignat is cookieless and privacy-friendly by default. No consent banners and GDPR-compliant out of the box.
Go cookielessMonitor traffic from AI tools
See how much traffic ChatGPT,
Claude,
Perplexity and other AI assistants send your way.
Global Audience Insights
See the countries, cities, and channels your audience arrives from, and spot new markets as they emerge.
Watch traffic livePerformance
Track Core Web Vitals on every real page load and catch slow pages before they cost you visitors.
Check your vitalsExperience score
Funnels
Map the steps that matter, see exactly where visitors drop off, and fix the leaks that cost you conversions.
Find your drop-offsAI Assistant
Ask questions about your traffic in plain words and get instant answers, charts, and filters built for you.
Ask your data anything
Ready when you are.
Ask anything about your traffic, or start with one of these.
Frequently asked questions

Every second of loadingcosts you visitors.
You are just a couple of minutes away from seeing your real-world vitals. Join the teams who see their stats plain and true.