From first reader to loyal audience

See which posts resonate, where readers come from, and what keeps them coming back. Set up in one minute.
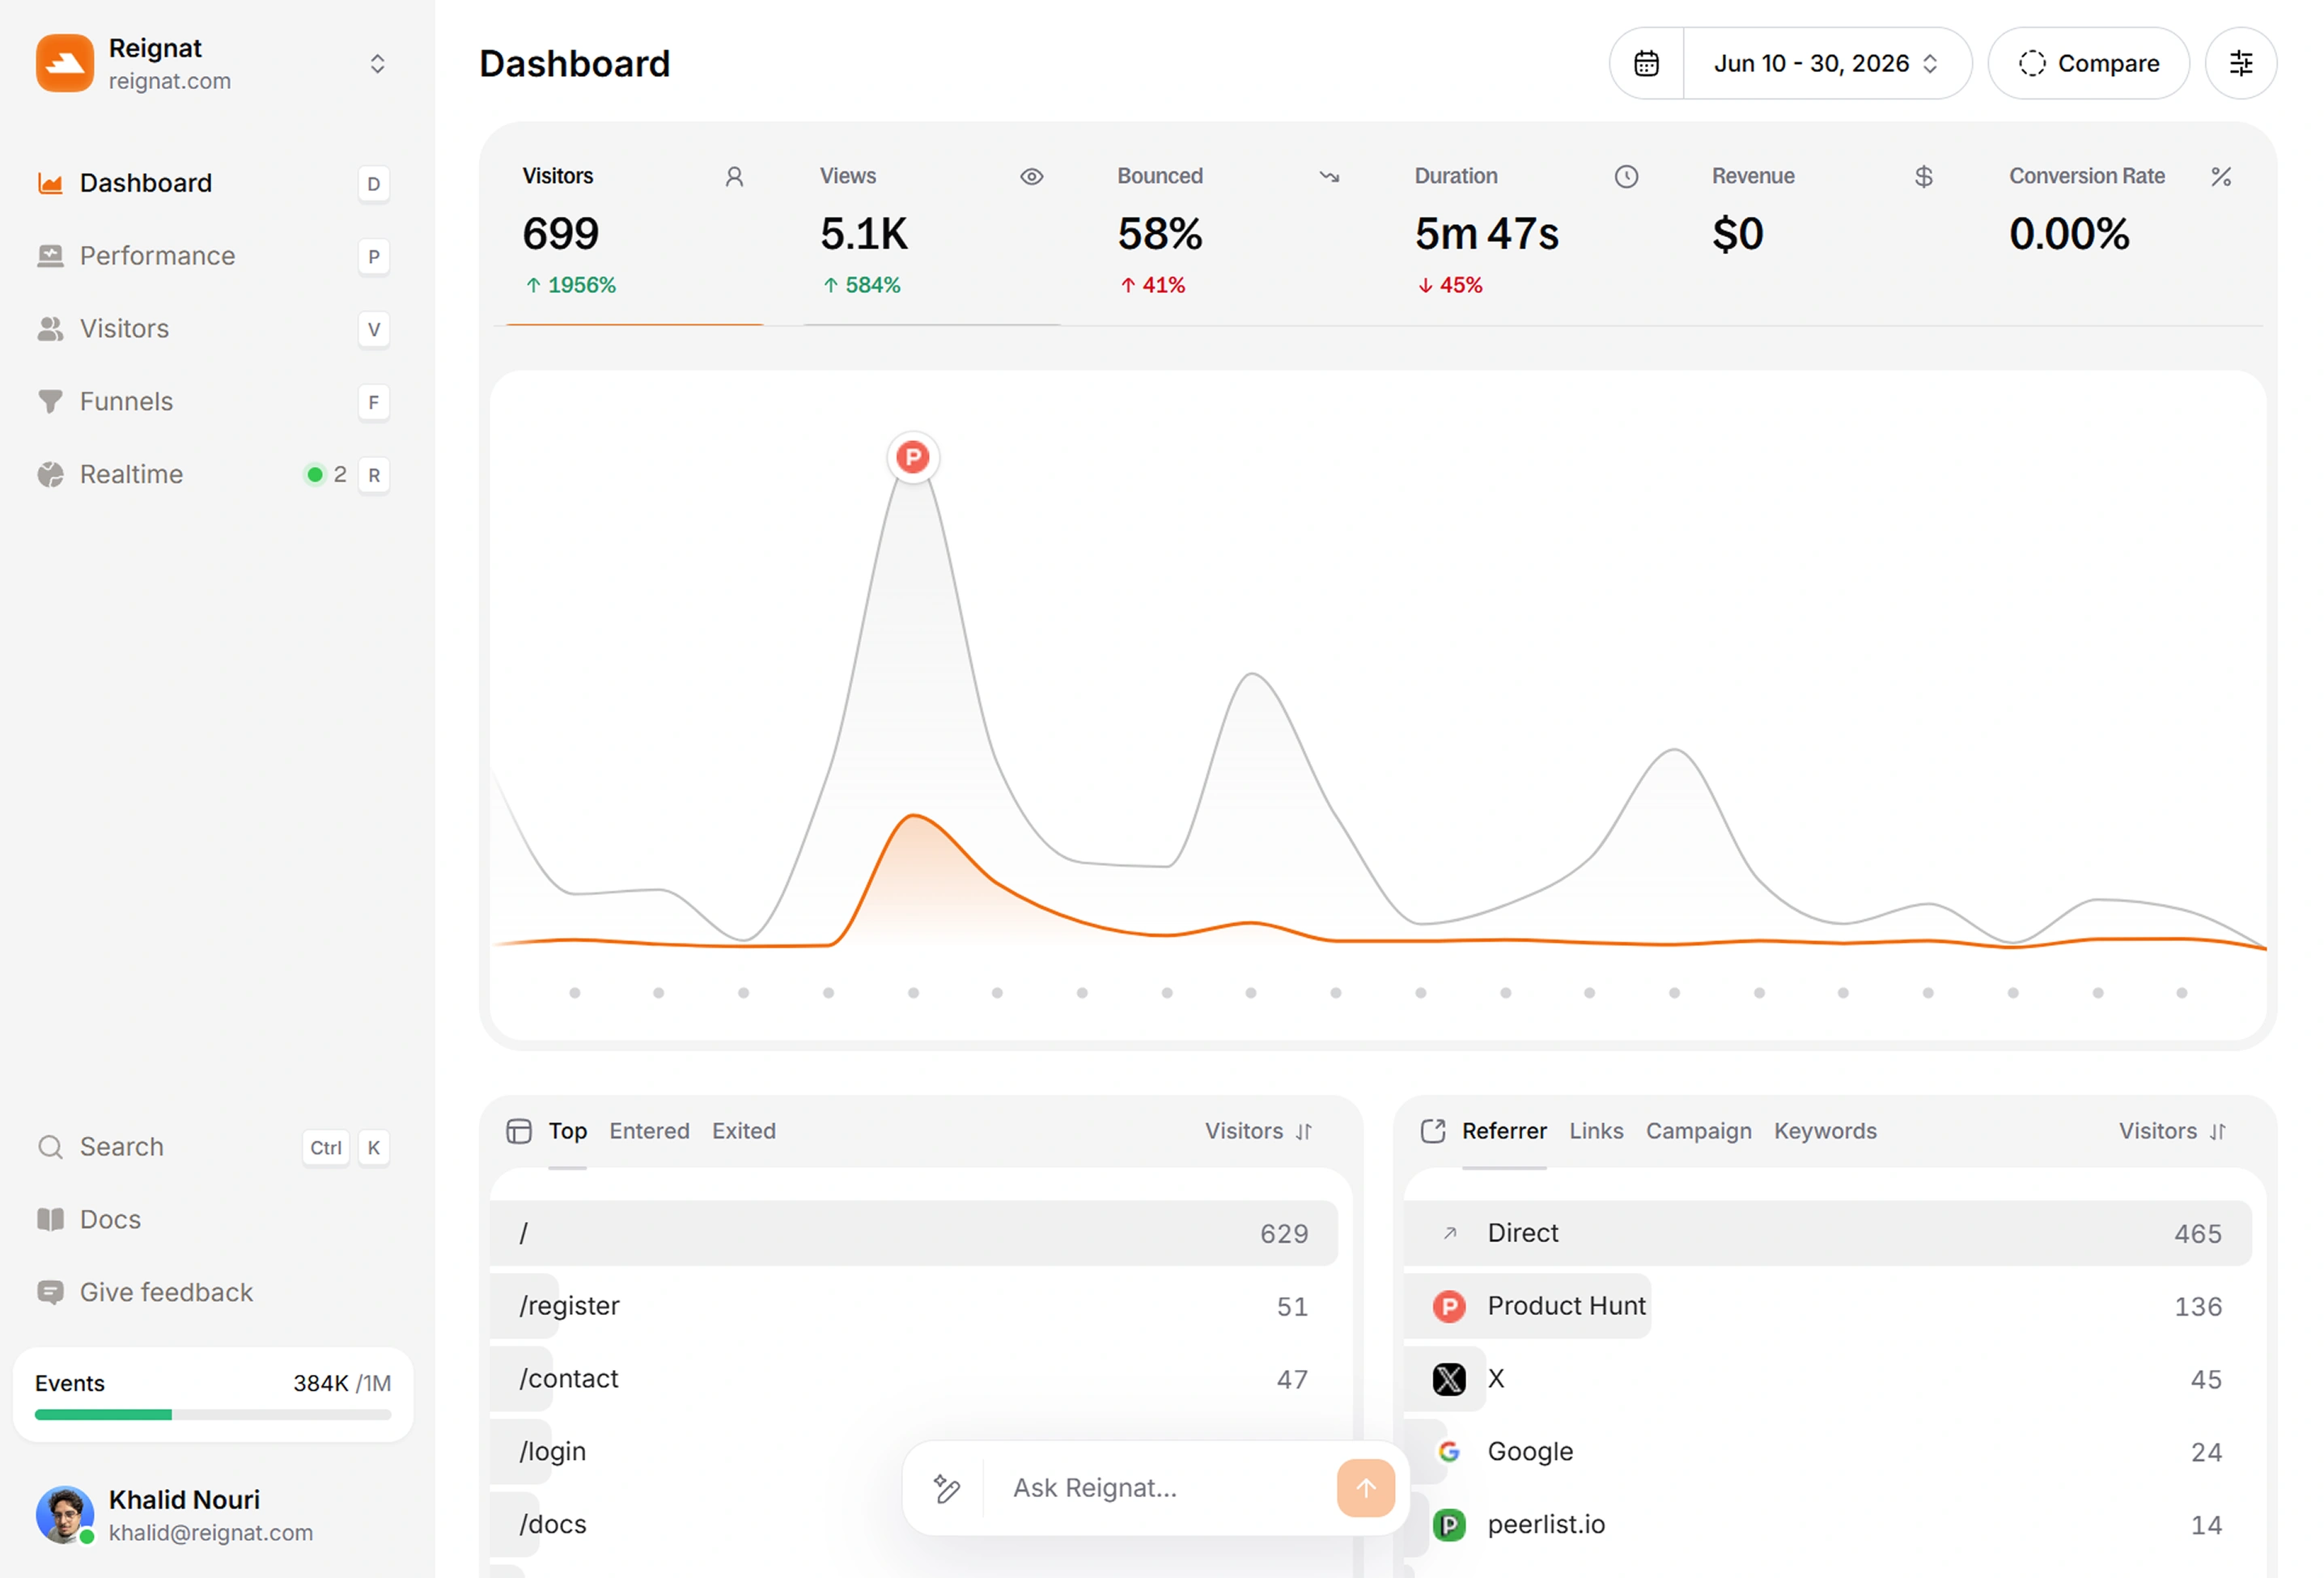
Everything a creator needs to grow
Readers, reach, and earnings in one dashboard, simple enough to check between posts.
Revenue Attribution
Connect memberships, tips, and sponsor links, and see exactly which posts and platforms earn for you.
See what earnsVisitor Profile
Follow a reader from their first visit to becoming a subscriber and learn which posts made the difference.
See a reader journeyNo cookie banners
Reignat is cookieless and privacy-friendly by default. No consent banners and GDPR-compliant out of the box.
Go cookielessMonitor traffic from AI tools
See how much traffic ChatGPT,
Claude,
Perplexity and other AI assistants send your way.
Global Audience Insights
See the countries and communities your readers come from and where your writing travels next.
Watch readers livePerformance
A slow blog loses readers mid-scroll. Track Core Web Vitals on real visits and keep every post snappy.
Check your vitalsExperience score
Funnels
Map the path from post to newsletter signup and see where readers drop before subscribing.
Find the drop-offsAI Assistant
Ask which post grew your newsletter the most this month and get an instant answer with charts.
Ask your data anything
Ready when you are.
Ask anything about your traffic, or start with one of these.
Built for how creators actually publish
Write, publish, share, repeat. Reignat shows what landed while you work on the next piece.
Know your readers
See how people move through your posts, what they read next, and which pieces turn a visitor into a regular.
Where your audience lives
See the countries, referrers, and newsletters your readers arrive from, and lean into the ones that grow you.
Track what pays
Send custom events for memberships, tips, and sponsor clicks, and see which content actually earns.
Light as your site
The tracking script weighs about 2kb, so your blog stays fast and your readers never notice it.
No cookie banners
Privacy-friendly tracking with no personal data stored keeps your pages clean for every reader.
Ask about your content
Ask which post brought the most subscribers this month and get an instant answer with charts.
Frequently asked questions

Write. Publish.Know what landed.
You are just a couple of minutes away from bringing your dashboard to life. Join the creators who see their stats plain and true.