From client pitch to monthly report

One dashboard per client, reports everyone understands, and public links you can share in seconds.
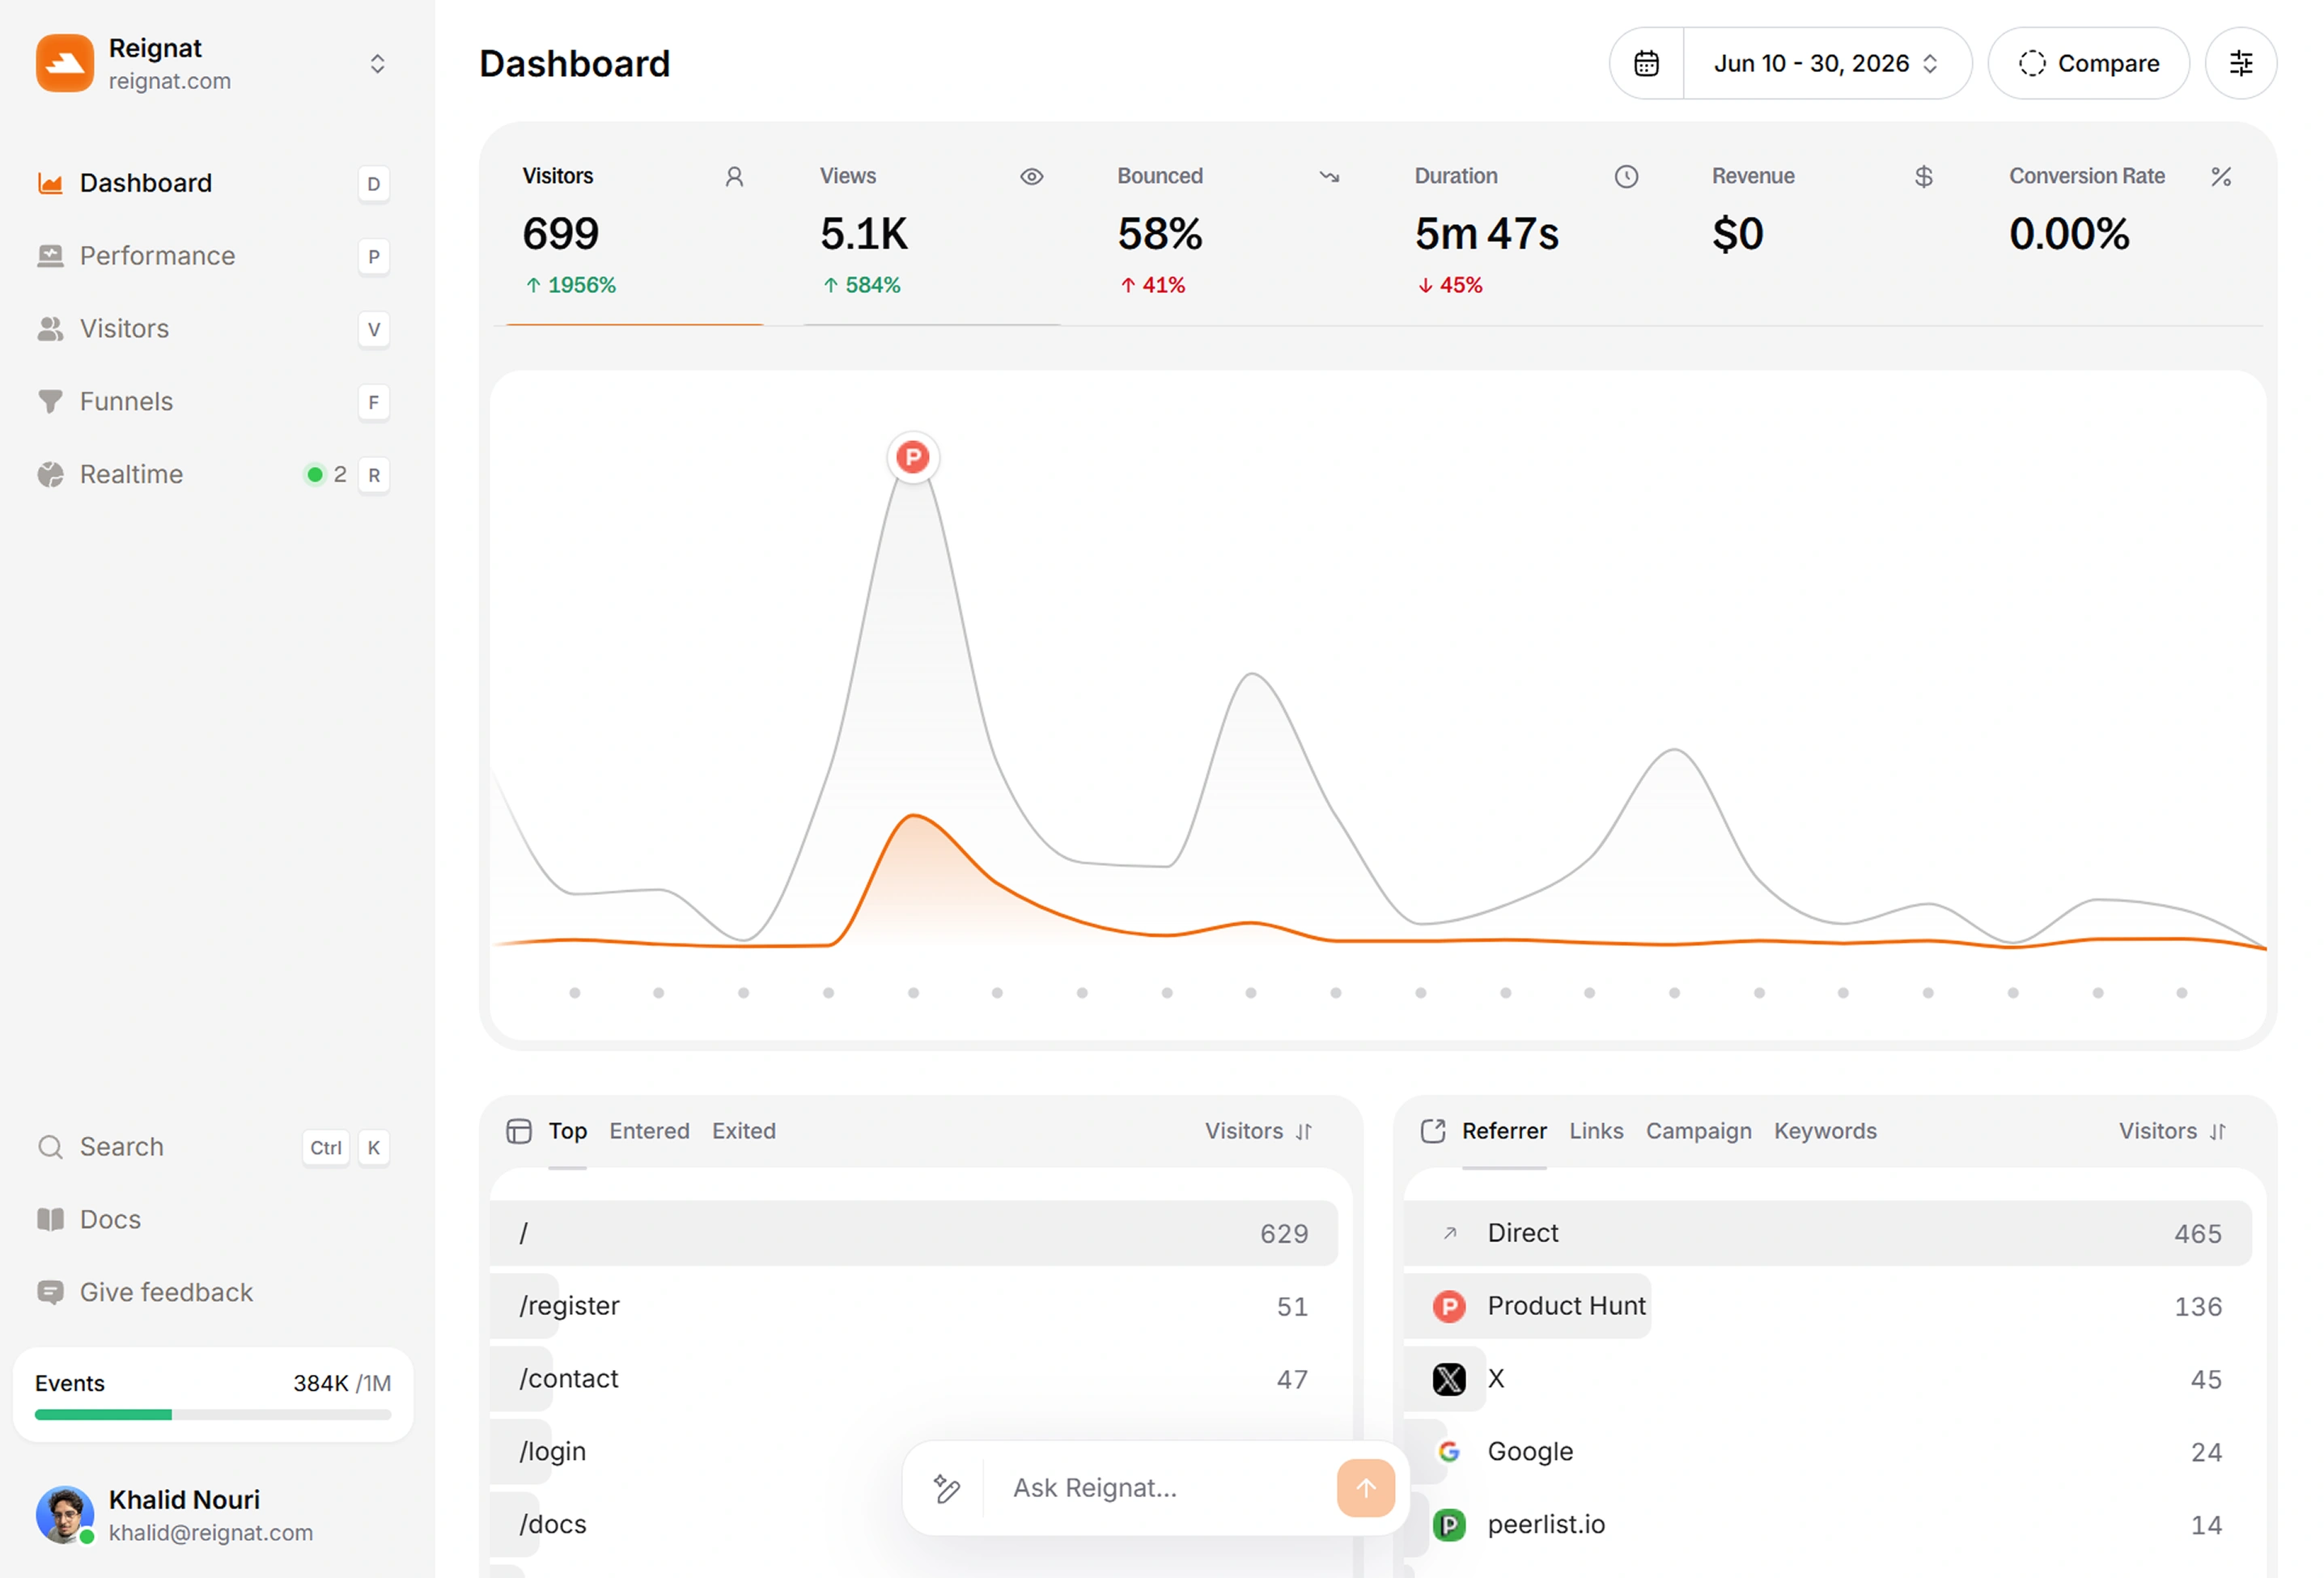
Everything your agency needs to report
Client traffic, campaign results, and revenue in one dashboard you can share as a link.
Revenue Attribution
Tie the campaigns you run to the revenue your clients earn, and show the return of your work without a spreadsheet.
See revenue by channelVisitor Profile
Show clients exactly how their visitors move from your campaign to their conversion, click by click.
See a visitor journeyNo cookie banners
Reignat is cookieless and privacy-friendly by default. No consent banners and GDPR-compliant out of the box.
Go cookielessMonitor traffic from AI tools
See how much traffic ChatGPT,
Claude,
Perplexity and other AI assistants send your way.
Global Audience Insights
See where each client's audience comes from and back your regional campaign proposals with live numbers.
Watch traffic livePerformance
Catch a client's slow pages before they blame the campaign, with Core Web Vitals from real visitors.
Check site vitalsExperience score
Funnels
Build the client's conversion funnel once and track the impact of every optimization you ship.
Find the drop-offsAI Assistant
Ask what moved on a client's site this month and get the answer with charts before the status call.
Ask your data anything
Ready when you are.
Ask anything about your traffic, or start with one of these.
Built for how agencies actually work
Many clients, many campaigns, one team. Reignat keeps every account's numbers one glance away.
A project per client
Keep every client's traffic in its own project, and invite teammates with roles so the whole agency shares one workspace.
Share-ready dashboards
Turn on a public link and send clients a live dashboard instead of a PDF. They check it whenever they want.
Prove the results
Tie campaign traffic to your client's revenue and show the return of your work in one chart at the monthly review.
Fast in every meeting
Dashboards load in a blink, even live in the room with a client watching over your shoulder.
No cookie banners
Privacy-friendly by default with no personal data stored, easy to sign off with your client's legal team.
Answers before the call
Ask what changed on a client's site this month and walk into the meeting with the answer and the chart.
Frequently asked questions

Happier clients.Shorter reports.
You are just a couple of minutes away from bringing your dashboards to life. Join the agencies who show their clients stats plain and true.